We have disucussed pod restart Grafana panel in AKS in the post "Pod Restart Counts Grafana Chart with Azure Monitor for AKS". We can create similar panel for container restarts using managed Grafana in Azure for AKS using Azure monitor.
Expected Outcome
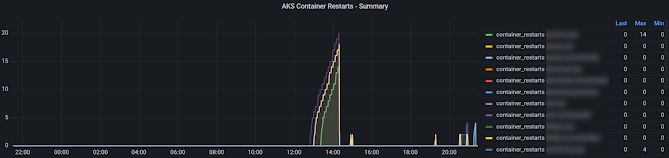
Panel similar to below showing contianer restarts for a applications over time with a table showing last container(s) of application restarts, maximum restarts for each application.
We can use the query below to create the container restart counts panel in Grafana with Azure monitor.
KubePodInventory
// | where $__timeFilter(TimeGenerated) // use only in grafana
| where ClusterName == "aks-chdemo-dev04"
| where Namespace in('mydemo')
| extend pod_label = todynamic(PodLabel)
| extend app_name = todynamic(pod_label[0].app)
| summarize container_restarts = sum(ContainerRestartCount) by TimeGenerated, tostring(app_name)
| order by TimeGenerated asc
| project TimeGenerated, tostring(app_name), container_restarts
The full json for Grafana panel is available in GitHub here. You can replace the id of the panel and the subscription, log analytics workspace name, resource group name etc.


No comments:
Post a Comment