If your pods are often restarting it might indicate a problem you might have in your application deployed to AKS. For example, there was some significant number of restarts seen in .NET 3.1 applications deployed to AKS (reason found as .NET 3.1 issue which is supposedly fixed in .NET 5, so the approach to fix was to update the applications to .NET 6), which were only appearing in development and in staging envronments, while QA environment haven't shown a single restart. Threfore, it is important to monitor the restart counts in pods to identify issues you might not see in development or QA envronements, but may occur in production environments. Let's see how we can create a pod restart count panel in managed Grafana in Azure for AKS using Azure monitor.
Expected Outcome
Panel similar to below showing pod restarts for a applications over time with a table showing last pod(s) of application restarts, maximum restarts for each application. If last count is zero and max count is greater than zero it indecates for that app current pod(s) has no restarts but there were restarts happend in the previous pod(s) in the given time period. If last count is greater than zero your application pod(s) deployed curently has restarts.
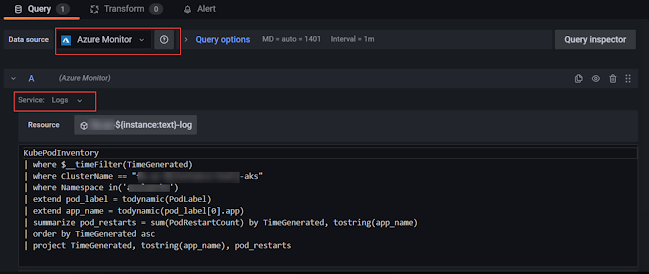
We can use the query below to create the pod restart counts panel in Grafana with Azure monitor.
The full json for Grafana panel is available in GitHub here. You can replace the id of the panel and the subscription, log analytics workspace name, resource group name etc.


No comments:
Post a Comment