AKS can be setup with automatic node scaling using VM scalesets in node pools. It will be useful to monitor how the nodes are scaling over time to have a good insights, in to the AKS cluster nodes behaviour, while applications deployed in the cluster getting heavy traffic. We can enable monitoring AKS cluster with Managed Grafana in Azure with Azure Monitor and Log Analytics Workspace. Let's look at query to setup node count over time panel in Managed Grafana in Azure using Azure Monitor.
The expected outcome is a panel similar to below. Showing each node pool scaling over time. The panel will show each node pool name in legend, and count of nodes over time for each node pool.
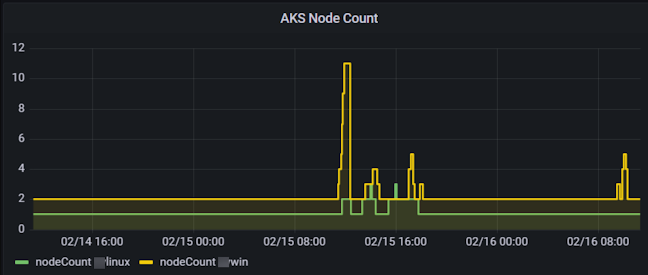
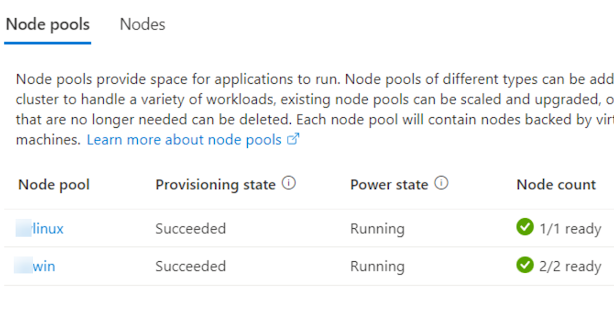
Above panel has two node pools as the cluster is having two node pools as shown below.
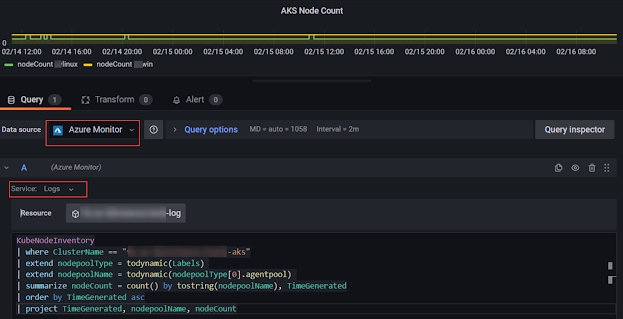
The query is used in Grafana panel editor as shown below. You should select Azure Monitor as datasource and use Logs as Service. Then provide your log analaytics workspace for AKS as the resource.
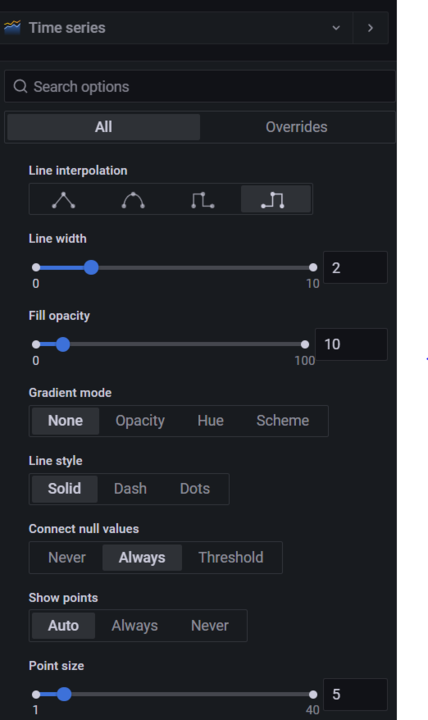
The following important settings needs to be used to diplay the chart correctly. If you use the json in GitHub (Modify with your panel id, subscription id etc.) and use query inspector of the panel to replace json for panel the below settings will be automatically applied.


No comments:
Post a Comment