Showing posts with label monitor. Show all posts

Saturday, 8 August 2026

Enabling Prometheus Data Scraping for Nginx-Gateway Deployed in - AKS Setup with Managed Prometheus

 We have discussed how to setup Nginx-Gateway instead of Nginx ingress controller in AKS in previous posts listed in the bottom of this post. We have also looked at  "Setup Managed Prometheus for AKS via Terraform" and "Deploying Azure Managed Grafana with Terraform" . For Nginx-Gateway deployed in AKS, we need to enable datascraping so that we can start monitring nginx metrices from managed grafana. Let's look at the steps required.

The expectation is getting metrices ti managed grafana as shown below.


Monday, 11 May 2026

Monitor and Profile Memory Usage in a Running .NET Linux Pod in AKS

 Sometimes we need to understand what causes high memeory usages or if any memory leaks in our application setup. When we see pod memeory is not reclaimed for longer intervals, analyzing the usage and diagnosing where exactly is the problem would be useful to fix the issues. Such profiling of memeory, we should be able to do in a running container inside a pod to understand the full details. Let's look at step by step how to profile and monitor memory usage in a .NET app running in a Linux pod in AKS.

Expectaion is to have the ability to monitor live counters as shown below.


Tuesday, 21 October 2025

Visualize Dead Letter Counts in RabbitMQ Deployed in AKS

 Using the prometheus data obtained by "Enabling Prometheus Data Scraping for RabbitMQ Cluster Deployed with RabbitMQ Cluster Operator on AKS with Managed Prometheus", let's create grafana chart to view any messages land in dead letter queues in the RabbitMQ cluster deployed in AKS.

The expection is to have a chart as shown below.


Friday, 10 October 2025

Enable Windows Data Scraping for AKS Managed Prometheus with Azure Managed Grafana

 We have "Setup Managed Prometheus for AKS via Terraform", however, that setup alone will not provide windows metrics from AKS clsuter to Azure managed Grafana. We have to addtionaly, setup Windows exporter and couple of additional configurations to make it work as decribed in the official Microsoft docs here. Let's look at step by step how to enable windows metrics for AKS with managed prometheus.

Expected outcome is getting metrics such as shown below to managed grafana and visualizing them.

Tuesday, 30 September 2025

Thursday, 25 September 2025

Enable Prometheus Data Scraping for Bitnami Redis Standalone Deployed on AKS with Managed Prometheus

 We have discussed "Enable Prometheus Data Scraping for Bitnami Redis Cluster Deployed on AKS with Managed Prometheus" in the previous post. Similar way we can setup Prometheus data scraping for standalone redis deployments on AKS as well. Here are the steps.

The expectaion is to have the metrics sidecar run with the standalone redis master and replica pods as shown below and setup a service monitor so that redis metrics data is made available in Azure managed grafana via managed prometheus on AKS. 

Monday, 15 September 2025

Enable Prometheus Data Scraping for Bitnami Redis Cluster Deployed on AKS with Managed Prometheus

 "Setup Redis Cluster with JSON and Search Modules on AKS with Binami Redis Using Custom Image" and "Setup Managed Prometheus for AKS via Terraform" are explained in the previous posts. To enable setting up monitoring and alerting for the Redis Custer deployed in AKS the first step is to enable Prometheus data scraping in the Redis cluster we deployed on AKS. Let's look at the steps in this post.

The expectation is to have redis metrices available to Azure managed grafana via the managed prometheus in AKS as shown below.

Wednesday, 10 September 2025

Setup Managed Prometheus for AKS via Terraform

 We have discussed "Deploying Azure Managed Grafana with Terraform" ealier. Now that we have managed grafana available in Azure for the AKS clsuters we can enable managed prometheus. You can setup prometheus on your own in AKS however it is beter to use Azure managed prometheus with AKS as it would leverage the capabilities of Azure monitor and Azure managed grafana to better monitoring and alerting abilities and avoid additional work required to setup full monitoring and observability on your own in an AKS cluster. The offcial documentation is here for leaning more information on the setup.

Wednesday, 29 January 2025

Setup Azure File Share Capacity Alert to Slack with Terraform

 Setting up an Azure File Share capacity alert is useful to know when you reach at least 80% of allocated quota for the file share. This will give the teams ample time to increase the allocation to avoid out of space issues. If we are using standard tier for storage account then we need to use one storage account for each file share, to get the correct alert. Sending the alert to slack channel is a useful way to get properly alerted to take action on time. Let's use an example learn how to setup alerts for multiple Azure file shares uing terraform.

Expectation is to get the alerts to slack channel as shown below.


Saturday, 2 September 2023

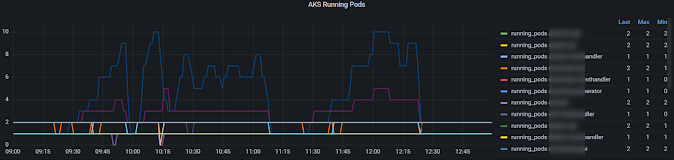
Running Pod Counts for All Services Summary - Grafana Chart with Azure Monitor for AKS

Monitoring the actual running pod count, against the desired pod count by each horizontal pod autoscaler, for your application is useful to get a summarize view, that will help to understand ow the pods are really scaling based on  scale out demand of each individual service. We can enable monitoring AKS cluster with Managed Grafana in Azure with Azure Monitor and Log Analytics Workspace. Let's write a query to and create Grafana chart for this purpose.

Expected Outcome

Each service actual scaling over time is shown as summary. This indicate based on load how each service in your application scale out based on the demanded by horizontal pod autoscaler.


Sunday, 11 June 2023

HPA Desired Pod Counts for All Services Summary - Grafana Chart with Azure Monitor for AKS

 Monitoring the desired pod count by each horizontal pod autoscaler for your application is useful to get a summarize view, that will help to understand scale out demand of each individual service. We can enable monitoring AKS cluster with Managed Grafana in Azure with Azure Monitor and Log Analytics Workspace. Let's write a query to and create Grafana chart for this purpose.

Saturday, 22 April 2023

Restart Count Details of Each Pod and Container for App in Grafana Chart with Azure Monitor for AKS

 Pod and container restart counts monitoring are discussed in posts "Pod Restart Counts Grafana Chart with Azure Monitor for AKS" and "Container Restart Counts Grafana Chart with Azure Monitor for AKS". Those two charts show summarized view per service. To view details of pod and container restarts for an individual service we can create another chart as described in this post.

Friday, 17 March 2023

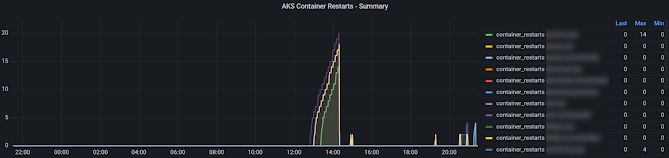
Container Restart Counts Grafana Chart with Azure Monitor for AKS

 We have disucussed pod restart Grafana panel in AKS in the post "Pod Restart Counts Grafana Chart with Azure Monitor for AKS". We can create similar panel for container restarts using managed Grafana in Azure for AKS using Azure monitor.

Expected Outcome

Panel similar to below showing contianer restarts for a applications over time with a table showing last container(s) of application restarts, maximum restarts for each application.


Saturday, 4 March 2023

Pod Restart Counts Grafana Chart with Azure Monitor for AKS

 If your pods are often restarting it might indicate a problem you might have in your application deployed to AKS. For example, there was some significant number of restarts seen in .NET 3.1 applications deployed to AKS (reason found as .NET 3.1 issue which is supposedly fixed in .NET 5, so the approach to fix was to update the applications to .NET 6), which were only appearing in development and in staging envronments, while QA environment haven't shown a single restart. Threfore, it is important to monitor the restart counts in pods to identify issues you might not see in development or QA envronements, but may occur in production environments. Let's see how we can create a pod restart count panel in managed Grafana in Azure for AKS using Azure monitor.

Monday, 27 February 2023

Pod Counts Grafana Chart with Azure Monitor for AKS

 We have discussed how to create a Grafana panel for view Horizontal Pod Autoscaler (HPA) desired pod counts in AKS (Azure Kubernetes Services) in the post "Horizontal Pod Autoscaler Desired Replica Count Grafana Chart with Azure Monitor for AKS". As desired count is changing in HPA for an app monitoring how the actual pod count is changing would be really useful insights. Let's look at steps required to implement Grafana chart for actual pod counts over time using Azure monitor fror AKS.

Monday, 20 February 2023

Horizontal Pod Autoscaler Desired Replica Count Grafana Chart with Azure Monitor for AKS

 Horizontal Pod Autoscaler (HPA) in Kubernetes manage the number of instances for each pod deployment based on the scale settings specified. Itw would be good insights to monitor the demand for scaling of each pod. as a prerequicite we need to setup monitoring AKS cluster with Managed Grafana in Azure with Azure Monitor and Log Analytics Workspace.  Let's see how we can create a Grafana pannel to monitor the HPA behaviour over time.

Thursday, 16 February 2023

Creating AKS Node Count Grafana Panel with Azure Monitor

 AKS can be setup with automatic node scaling using VM scalesets in node pools. It will be useful to monitor how the nodes are scaling over time to have  a good insights, in to the AKS cluster nodes behaviour, while applications deployed in the cluster getting heavy traffic. We can enable monitoring AKS cluster with Managed Grafana in Azure with Azure Monitor and Log Analytics Workspace.  Let's look at query to setup node count over time panel in Managed Grafana in Azure using Azure Monitor.

Popular Posts