Expected Outcome
Each service actual scaling over time is shown as summary. This indicate based on load how each service in your application scale out based on the demanded by horizontal pod autoscaler.
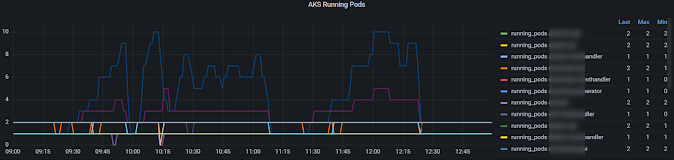
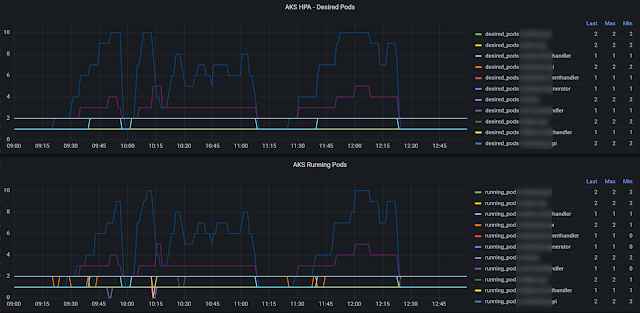
This is useful when we compare the actual running pods with desired pod counts as shown below.
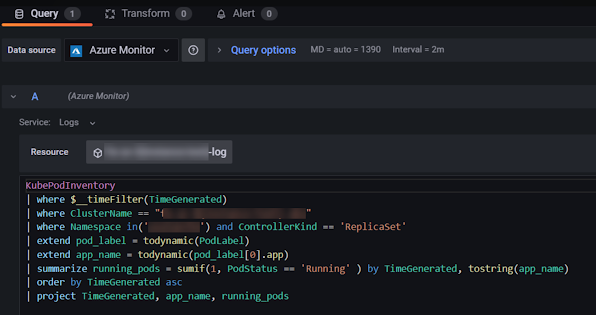
We can use the query below to create the running pod count summary panel in Grafana with Azure monitor.
KubePodInventory
// | where $__timeFilter(TimeGenerated) // use only in grafana
| where ClusterName == "aks-chdemo-dev04"
| where Namespace in('mydemo') and ControllerKind == 'ReplicaSet'
| extend pod_label = todynamic(PodLabel)
| extend app_name = todynamic(pod_label[0].app)
| summarize running_pods = sumif(1, PodStatus == 'Running' ) by TimeGenerated, tostring(app_name)
| order by TimeGenerated asc
| project TimeGenerated, app_name, running_pods
The full json for Grafana panel is available in GitHub here. You can replace the id of the panel and the subscription, log analytics workspace name, resource group name etc.
If you use the json in GitHub (Modify with your panel id, subscription id etc.) and use query inspector of the panel to replace json for panel the required settings will be automatically applied.


No comments:
Post a Comment