Expected Outcome
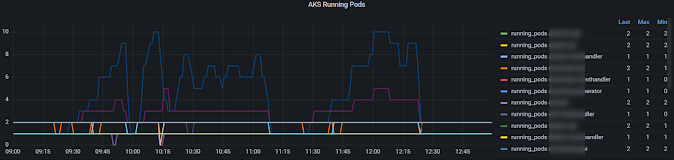
Each service actual scaling over time is shown as summary. This indicate based on load how each service in your application scale out based on the demanded by horizontal pod autoscaler.
Expected Outcome
Each service actual scaling over time is shown as summary. This indicate based on load how each service in your application scale out based on the demanded by horizontal pod autoscaler.
Monitoring the desired pod count by each horizontal pod autoscaler for your application is useful to get a summarize view, that will help to understand scale out demand of each individual service. We can enable monitoring AKS cluster with Managed Grafana in Azure with Azure Monitor and Log Analytics Workspace. Let's write a query to and create Grafana chart for this purpose.


