It would be usefull to figure out how many pods running in a given AKS cluster sometimes for various diagnostic needs. In this post let's see how we can use kubectl command to get pod count in diffrent combinations.
Below are some examples.

It would be usefull to figure out how many pods running in a given AKS cluster sometimes for various diagnostic needs. In this post let's see how we can use kubectl command to get pod count in diffrent combinations.
Below are some examples.
In AKS processing files on AKS node disk by application pod is not a recommended approach. It could lead to issues in stability of the AKS node itself. Therefore, we have two options. Either mount an Azure fileshare to the pod as described in "Mount Azure Storage Fileshare Created with Terraform on AKS". The other option is to setup a per pod disk, specially when the need is to process larger files. This option is really useful when we have pods running a single job and when it lives for the lifetime of the job. Example case is use of KEDA scale object with per single message processing from rabbitmq as described in "RabbitMQ KEDA Trigger for AKS Deployed Apps to Scale Out the Apps Accurately".
Expentation is to get a per pod disk attached as shown below.

In previous post we have discussed "Setup Managed Prometheus for AKS via Terraform" and "Enable Windows Data Scraping for AKS Managed Prometheus with Azure Managed Grafana". Understanding memory usage % for each application pod running in AKS, and setup alerts for higher uasge is useful to identify memory allocation requirements or any memory leaks in applications. Let's look at how to setup a chart in Azure Managed Grafana using AKS managed prometheus data.
The expectation is to get a chart as shown below.

If we are using Microsoft hosted agents for Azure pipelines to deploy Azure infrastucture and need to access vNet protected urls of services deployed, we can use a pod in AKS cluster within same vNet, as a jump host. This gives us access endpoints in vNet and ability to resolve DNS defined in private DNS zones of the vNet. Let's look at staep by step how to achive this goal, while using a Microsoft hosted agent in Azure pipelines.
The expectation is to access url such as
http://es-search.sh.aks.ch-demo-dev-euw-002.net/demoindex001/_count so AKS hosted elastic seach is accessed via a AKS pod and get the results to the pipeline agent as shown below. Since microsoft hosted agent is outside the vNET it cannot directly reach this elastc search (deployed in AKS) url.

Sometmes it would be necessery to identify which priority classes are used in each pod in a kubernetes environment, specially to plan and reorganize priorities in apps deployed. Let's look at a query to view pods with priority classes using kubectl.
Below command will get all pods in all namespaces with their priority classes name and priority value. The highest priority number value is the highet priority.
Azure Kubernetes Services (AKS) pod restarts can be obtained from the KubePodInventory of the connected log analytics workspace. This data can be depicted in a graph in grafana as described in the post "Pod Restart Counts Grafana Chart with Azure Monitor for AKS". Let's explore how to use same information to create an alert using Grafana to notify when pod restarts are happening in apps in a given kubernetes namespace.
The expectation is to fire alerts from Grafana as shwon below. Note that the alerts can target to send emails, slack notficaition etc. which is not discussed in this post.

We may sometimes want to jump into a container deployed in kubernetes pod to investigate the conntents of a container, such as files in it or even we may want to run commands and see how they work inside a deployed container. For that purpose we need to jump into the container and obtian the command shell in that container. Let's look at how we can jump into both Linux and Windows containers.
Pod and container restart counts monitoring are discussed in posts "Pod Restart Counts Grafana Chart with Azure Monitor for AKS" and "Container Restart Counts Grafana Chart with Azure Monitor for AKS". Those two charts show summarized view per service. To view details of pod and container restarts for an individual service we can create another chart as described in this post.
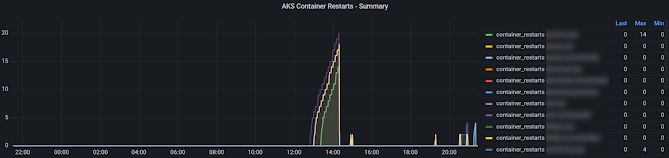
We have disucussed pod restart Grafana panel in AKS in the post "Pod Restart Counts Grafana Chart with Azure Monitor for AKS". We can create similar panel for container restarts using managed Grafana in Azure for AKS using Azure monitor.
Expected Outcome
Panel similar to below showing contianer restarts for a applications over time with a table showing last container(s) of application restarts, maximum restarts for each application.
If your pods are often restarting it might indicate a problem you might have in your application deployed to AKS. For example, there was some significant number of restarts seen in .NET 3.1 applications deployed to AKS (reason found as .NET 3.1 issue which is supposedly fixed in .NET 5, so the approach to fix was to update the applications to .NET 6), which were only appearing in development and in staging envronments, while QA environment haven't shown a single restart. Threfore, it is important to monitor the restart counts in pods to identify issues you might not see in development or QA envronements, but may occur in production environments. Let's see how we can create a pod restart count panel in managed Grafana in Azure for AKS using Azure monitor.
We have discussed how to create a Grafana panel for view Horizontal Pod Autoscaler (HPA) desired pod counts in AKS (Azure Kubernetes Services) in the post "Horizontal Pod Autoscaler Desired Replica Count Grafana Chart with Azure Monitor for AKS". As desired count is changing in HPA for an app monitoring how the actual pod count is changing would be really useful insights. Let's look at steps required to implement Grafana chart for actual pod counts over time using Azure monitor fror AKS.
We have discussed about enabling detailed request, resposnse logs in ASP.NET Core APIs in the post "Log All Requests in ASP.NET Core API". In a contianerinzed API running in a Kubernetes cluster, say AKS, you would be interested in reading these logs to debug some error or for quick monitoring on the requests made. Implementing a proper monitoring solution using ELK for Kubernetes is more useful, however, doing a quick look at logs of contianers/pods will help as well at times. When you run kubectl logs podname-xxxxxxxxxx-xxxxxx -n k8snamesapce you will get the entire log of a particular pod. But depending on pod age it may be a long log and you might only be interested in couple of minutes or last hour details to have a quick look. Let's see how we can limit and read pod logs for a time frame or number of log lines.


